Besides being used as a key source of nutrition, edible oils are a major raw material used in the food industry. Vegetable oils are highly significant, due to their higher content of mono- and polyunsaturated fatty acids compared with animal fats.
This article discusses the application of B&W Tek’s portable Raman spectrometer equipped with chemometrics software (Figure 1) to analyze the key constituents of colza oil, sunflower seed oil, arachis oil, camellia oil, and olive oil.

Figure 1. B&W Tek’s portable Raman spectrometer equipped with chemometrics software
Determining the concentration of key ingredients in a variety of edible oils for at-line testing is the objective of this analysis. Hence, this study demonstrates the ability of portable Raman spectroscopy to obtain data regarding the chemical processes occurring during lipid oxidation in a fast and experimentally convenient approach.
i-Raman Portable Raman Spectrometer and BWIQ Quantitative Software
Conventional edible-oil analysis techniques such as gas chromatography-mass spectrometry (GC-MS) are laborious and function only under laboratory environments. Conversely, Raman spectroscopy is fast and does not need any sample preparation steps before analysis. The i-Raman® from B&W Tek features the company’s patented CleanLaze® technology for narrow linewidth and unprecedented laser stabilization.
The i-Raman® has a broad Raman shift coverage up to 4000cm-1, spectral resolution as fine as 3cm-1, and a TE-cooled 2048 pixel CCD array. It is capable of performing data acquisition within 65cm-1 of the Rayleigh Line, thanks to a convenient fiber optic interface.
With a weight of below 7lbs and a unique combination of high resolution and field-portability, the i-Raman® delivers a performance that is as good as large bench-top Raman systems. Users can perform sample measurements with various physical states using a host of dedicated accessories. In the case of edible-oil analyses, Raman spectra are obtained using a Raman cuvette holder BCR100A.
Being a multivariate analysis package, BWIQ® chemometrics software explores the spectral data to determine the internal relationships between spectra and sample classes and/or spectra and response data.
The combination of new and transitional chemometrics techniques and sophisticated computer science technology makes BWIQ to perform qualitative and quantitative analyses rapidly and accurately. In this experiment, BWIQ with sophisticated spectral preprocessing and PLS regression facilitates determining different constituents of several edible oils.
Experimental Procedure
The samples used were colza oil, sunflower seed oil, arachis oil, camellia oil and olive oil, with a total sample count of 150 that include 30 samples from each category.
The instrument used was an i-Raman portable spectrometer with 785nm laser excitation and Raman shift range of 175-2600cm-1. The integration time was 9s. Raw Raman spectra of different types of edible oil are depicted in Figure 2. Preprocessing such as Savitzky-Golay smoothing and background removal were applied to optimize the signal-to-noise ratio of the Raman spectra.
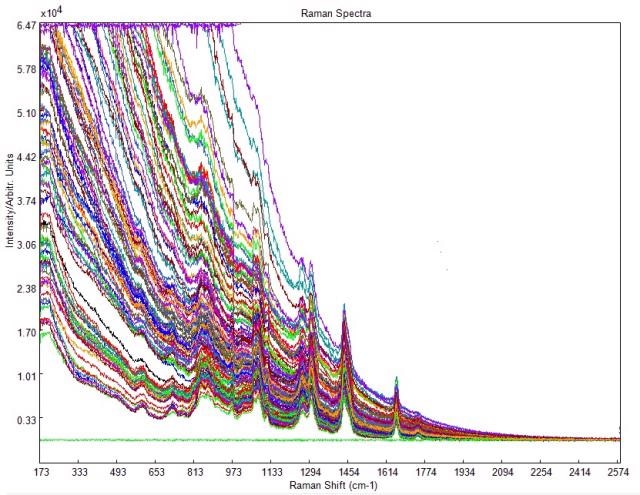
Figure 2. Raw Raman spectra of different types of edible oil
Raman spectra of various edible oils were acquired and quantitative analysis for the component concentration was performed.
GC-MS was used to measure the reference values for the concentration of the ingredients of edible oils, including saturated fatty acid, polyunsaturated fatty acid, mono-unsaturated fatty acids, linoleic acid, and oleic acid.
Using the Raman spectra acquired for 150 samples, a quantitative PLS regression model was created using the BWIQ software.
Experimental Results
The model for all five constituents (PLS2) was constructed using the PLS regression. The typical Raman bands were chosen manually to highlight the spectral regions related to the characteristic bands of the unsaturation, saturation, and backbone of the various acids. Table 1 summarizes the PLS regression results for all chemical values of aforementioned ingredients.
Table 1. PLS model results
| Ingredients |
coefficient of correlation |
RMSEP |
| oleic acid |
0.95 |
0.24 |
| linoleic acid |
0.97 |
0.17 |
| mono-unsaturated fatty acids |
0.96 |
0.23 |
| polyunsaturated fatty acid |
0.98 |
0.15 |
| saturated fatty acid |
0.84 |
0.15 |
Both Root Mean Square Error of Prediction (RMSEP) and coefficient of correlation demonstrate the capability of this model to deduce the components in the edible oils as a key index to assess the quality. With this model, an i-Raman portable spectrometer was used to measure samples of different types to deduce the chemical values in BWIQ software. The results of prediction for each component are depicted in Figures 3 and 4. The saturated fatty acid prediction sample set may be an outlier in the system as it shows a large deviation.
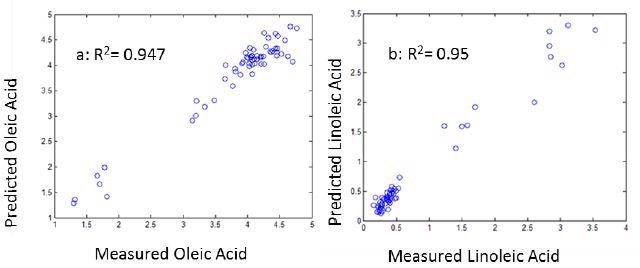
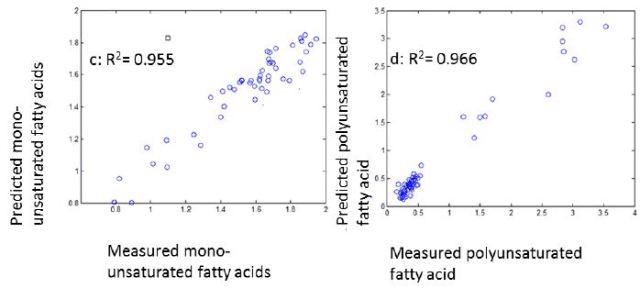
Figure 3. a) oleic acid b)linoleic acid c)mono-unsaturated fatty acids d)polyunsaturated fatty acid prediction results
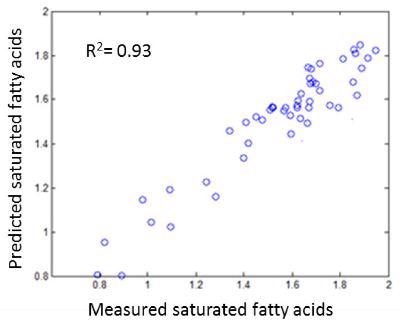
Figure 4. Saturated fatty acid prediction result
The BWIQ software facilitates determining the outlying samples both graphically and from model statistics. In this experiment, a new model was constructed in BWIQ software after rejecting the outlying sample.
Conclusion
This article demonstrates the use of the portable i- Raman spectrometer and BWIQ chemometric software to develop the calibration models for five components in the edible oils. The prediction results for all constituents are in good agreement with the GC-MS values, and can be collected rapidly and nondestructively with the help of the portable Raman spectrometer. It is possible to measure the oils samples in disposable glass vials of cuvettes with no further sample preparation. Furthermore, it is possible to optimize the results if the model is constructed corresponding to each ingredient.

This information has been sourced, reviewed and adapted from materials provided by B&W Tek.
For more information on this source, please visit B&W Tek.