A new Raman system design is presented that expands the applicability of Raman to See Through diffusely scattering media such as opaque packaging materials, as well as to measure the Raman spectrum and identify thermolabile, photolabile, or heterogeneous samples.
Conventional Raman fiber optics probes use a focused design similar to confocal microscopes. Excited light that comes out of the laser fiber is collimated and then concentrated on the sample by a focusing optics, with same optics also collimating the Raman signal beam scattered by the sample while a separate lens focuses it to a signal collection fiber. Usually, the sample is placed at the focal plane of the focusing lens.
This has the effect of maximizing excitation power density and consequently the Raman signal density at the sampled volume, so that only signal from this concentrated volume is collected by the collection fiber. This confocal design has the benefit of maximum throughput, and can measure samples inside transparent containers in the same way a confocal microscope does optical sectioning.
However, when the container is a strong diffuser of light, this confocal approach is not as effective, due to light no longer being focused inside the container. The Raman signal for materials inside diffusely scattering containers is weak, and can often be obscured by strong features from the container itself.
Spatially Offset Raman Spectroscopy (SORS)1 intentionally offsets the excitation beam and collection beam, and is therefore effective in collecting Raman signal produced underneath diffusive top layers while mostly avoiding their signature from overwhelming that of the sample. The downside to this approach is that the probes cannot easily form a confocal arrangement and are generally extremely inefficient for direct sample measurements.
The See Through STRam Analyzer developed by B&W Tek illuminates and collects the Raman scattered light from a large sample area. This massively improves the effective sampling depth, allowing material inside visually opaque containers to be analyzed as the relative intensity of the signal from the underlying layers increases even as the overall signal is lower.
The greater sampling area also has the advantage of preventing sample damage by dropping the power density, as well as improving measurement accuracy by removing heterogeneous effect. The high throughput design of the See Through analyzer detects common chemicals through a range of non-transparent packaging materials in seconds.
There are a range of accessories to take advantage of the system’s high throughput design allowing for standoff, contact, or microscopy Raman analysis as part of conventional confocal Raman measurements. This flexibility coupled with portability makes the i-Raman® Pro ST Analyzer the perfect tool for a variety of applications, from incoming material identification to quality control to vital research.
The following are some examples that demonstrate the advantages of the STRam™ technology. All spectra were collected with an i-Raman Pro ST spectrometer equipped with a 450 mW 785 nm laser (B&W Tek), and the intensity axis corrected using the procedure developed at the National Institute of Standards and Technology.2
i-Raman Pro ST See Through Measurements
Through Diffusely Scattering Plastic Containers
It is typical when ordering small quantities of chemicals for them to arrive in white plastic bottles that are usually made of titanium dioxide filled polyethylene. The titania scatters the light so that the material appears opaque to the naked eye.
The scattering is so strong that laser light cannot focus inside the container, precluding the use of conventional Raman backscatter measurement designs. However, by using the STRam technology 785 nm laser and the Raman scattered light can infiltrate the container wall through diffuse scattering, with the large effective sampling depth meaning the material inside can be analyzed.
Figure 1 shows the measurement of sodium benzoate through the walls of one of these containers. The STRam configuration demonstrates a strong contribution from the sodium benzoate on top of the container signature as in 1(a), while the measurement take using a traditional configuration mostly consists of data from the container, with only a small contribution from the sample inside as in 1(b). By subtracting properly scaled (b) from (a) then spectrum 1(c) is gained, which is very similar to that of pure sodium benzoate as shown in 1(d).
The STID software uses a proprietary algorithm to confine the content signature from the packaging and can identify even very weak Raman scatterers such as metal oxides inside strong scattering package material.

Figure 1. STRam for identification of sodium benzoate through a white polyethylene bottle: (a) Spectrum measured through the bottle using the STRam technology; (b) spectrum measured with a standard Raman configuration; (c) the result of scaled subtraction of (b) from (a); and (d) pure spectrum of sodim benzoate.
Through Paper Envelopes
Paper is a strong light scatterer due to the cellulose fibers that make it up, which means Raman spectra of paper products often come with strong fluorescence. Using regular confocal Raman configuration on a manila envelope, the signature of cellulose can only be observed on top of a fluorescence background as seen in 2(b). When STRam technology is used instead D-(+) glucose is readily identified when measured through a manila envelope, as shown in figure 2(a).
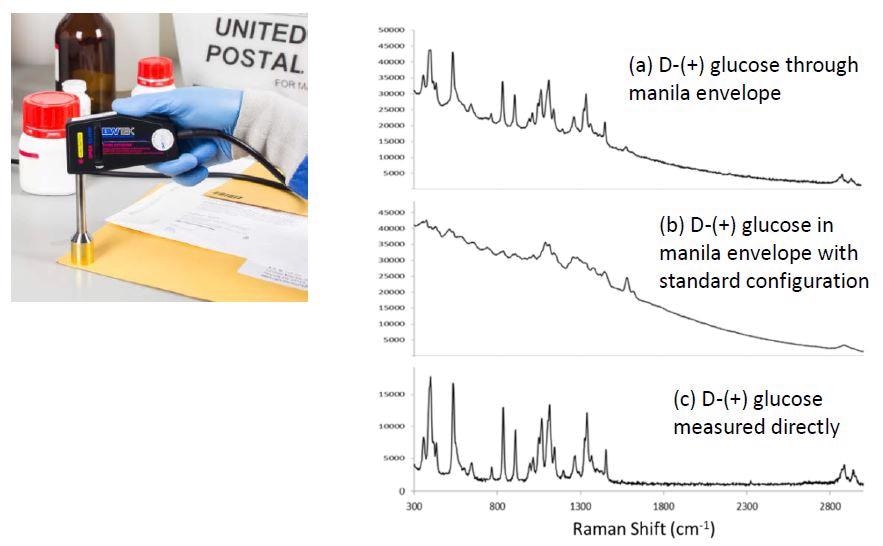
Figure 2. STRam for identification of D-(+) glucose through a manila envelope. (a) Spectrum measured through the envelope using the STRam technology; (b) spectrum measured in envelope with a standard Raman configuration; (c) spectrum of D-(+) glucose measured directly with a standard Raman configuration (no packaging materials).
Coated Tablets
Traditional Raman spectroscopy has difficulty in penetration deep into a sample, which makes it hard to identify oral medications that come as coated tablets. From figure 3(b) the actual drugs Raman signature is nearly totally obscured by the coating (peaks between 600 and 1400 cm-1 are signatures of sucrose, a main part of the coating). By utilizing STRam technology, it can be seen from 3(a) that the signature from the drug is the strongest, comparable to that of the pure drug in 3(c).
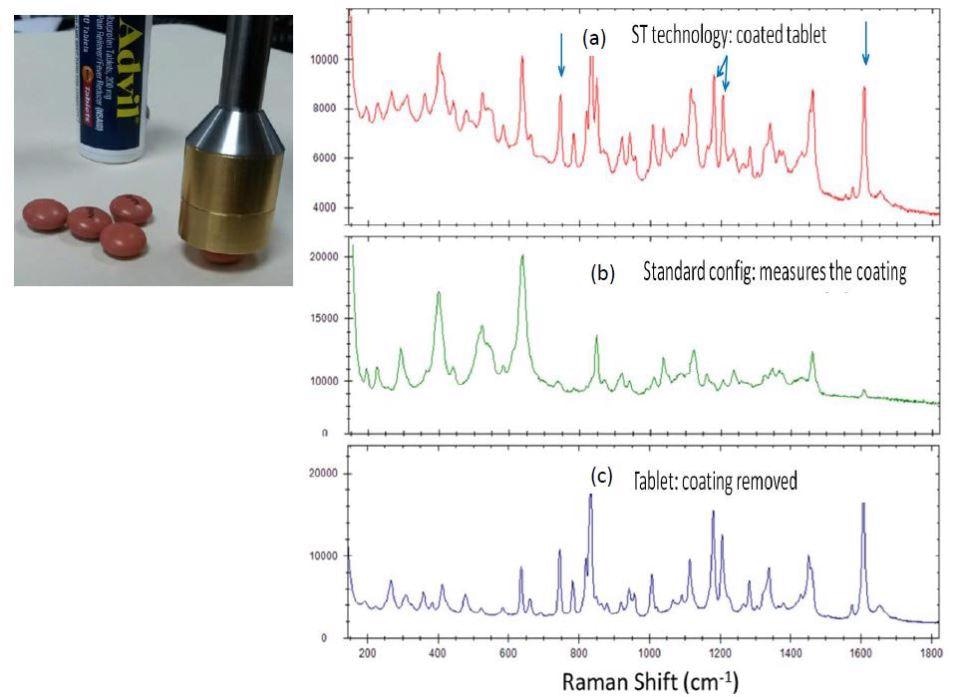
Figure 3. STRam for measurement of coated Advil tablets. (a) Coated tablet spectrum measured using the STRam technology; (b) Coated tablet spectrum measured with a standard Raman configuration; (c) spectrum of the tablet with the coating stripped measured with a standard configuration.
i-Raman Pro ST Provides Decreased Power Density
The STRam system has a large sampling area, which spreads the laser power, making it ideal for analyzing dark materials. This is because they absorb light which can lead to increased heating of an area and then damage. BY using STRam, sensitive samples such as photolabile or thermolabile material, and tissues can be analyzed. For example, figure 4 shows a sample of gun powder obtained using STRam technology at full power. The Raman peaks show major gun powder components sulfur at 217.6 cm-1 and 471.5 cm-1, and nitrate at 1049.3 cm-1.
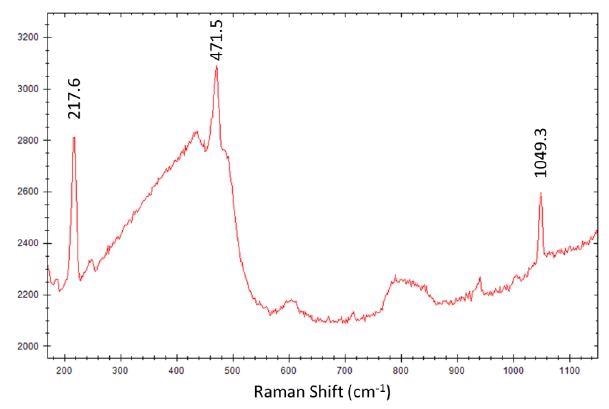
Figure 4. i-Raman Pro ST spectrum of gun powder with main peaks of sulfur and nitrate marked.
The large sampling area enables deep penetration with low power density which makes STRam technology suitable for examining mammal tissue in vivo. Figure 5 shows the spectra of human tibia and muscle tissue examined transcutaneously. As expected, the phosphate signature is pronounced in the tibia spectrum measured with STRam while absent in the leg tissue. Other observable differences include stronger peaks in the tissue spectrum arising from the amide III, the CH2 wagging, the amide I,3 and the C=O stretching bands.4
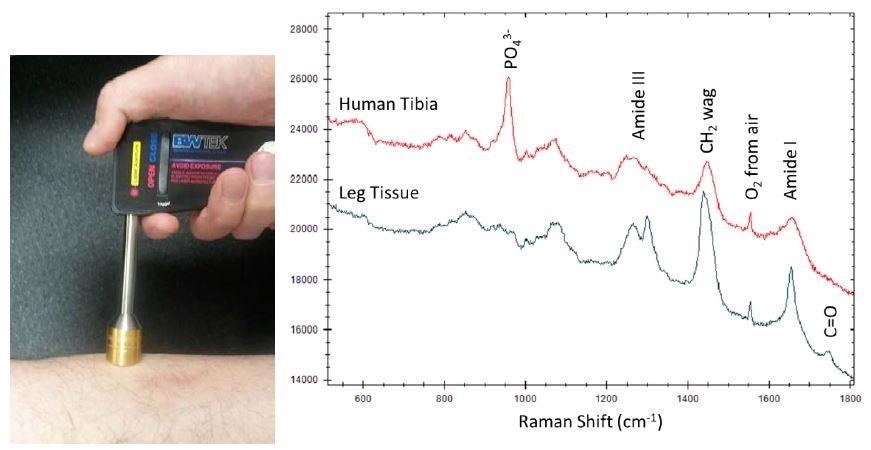
Figure 5. Transcutaneously collected STRam spectra of human tibia and leg tissue.
STRam With Larger Sampling Area for Heterogeneous Samples
Traditional Raman spectroscopy usually has a small sampling area (around 100 microns) which can lead to a variation in measurement results from one sampling point to another. This can make it difficult to get a representative sample of a heterogeneous material in order to obtain bulk properties. For products with multiple components, with excipients and one or more active ingredients a larger sampling area is necessary for consistent measurements. If the ingredients are not properly mixed on a scale smaller than the sampling area, then collection of spectra at different points over the sample can give widely varying results.
Figure 6(a) compares spectra gained from conventional Raman measurements with spot size of ~ 100 microns to a STRam probe with a larger sampling area of several mm. The 15 spectra (baseline-subtracted and intensity normalized) were obtained over randomly chosen positions using a standard configuration, which has a sampling area of roughly 0.3 mm in diameter. The 3 active ingredients, namely acetaminophen, aspirin, and caffeine all a have detectable signatures in the spectra, but their relative intensities vary greatly reflecting the sample heterogeneity.
This makes it difficult to identify the true composition of the product. This can be demonstrated by taking several of such spectra, calculating their average, and using it to represent the product in a spectral library. Each measurement is searched within the library and a hit quality index (HQI) is obtained against the Excedrin Migraine reference spectrum, to get a distribution of results reflecting the sample heterogeneity at this small scale.
Figure 6(b) shows a histogram of 43 such measurements. Using a passing threshold of 95, 18 of the sample spectra result in false negatives. The average and standard deviation of the 43 HQI values are 93.4 and 6.1, respectively.
Figures 6(c) and 6(d) shows of 17 measurements taken using the larger sampling area of the STRam configuration, which means each area is more representative of the bulk tablet properties. With the average and standard deviation of the HQI values at 99.89 and 0.07, respectively, the reproducibility of the spectrum and therefore the identification is greatly improved, with no false negative results in the 17 measurements.
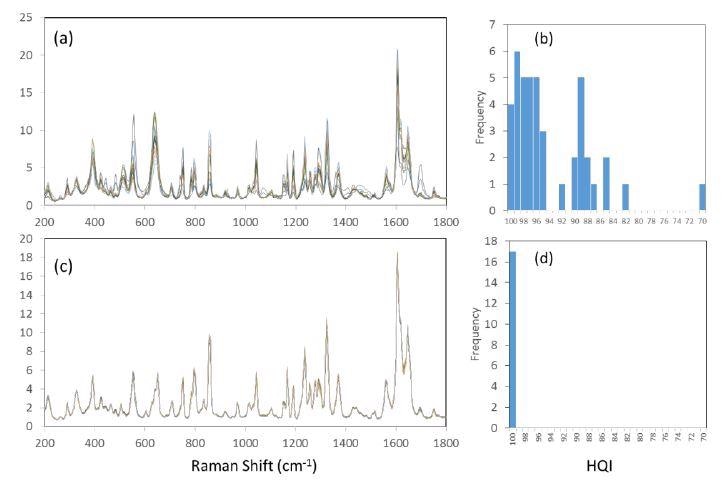
Figure 6. Comparative spectra of Excedrin migraine tablet as measured at various sample positions. (a) overlay of 15 spectra acquired with conventional Raman configuration; (b) histogram of 43 HQI values with conventional Raman configuration. (c) overlay of 15 spectra acquired with STRam configuration; (d) histogram of 17 HQI values with STRam configuration.
If the sample has a large crystalline form, this can also cause issues when sampled over a small area. The Raman polarization effect causes the spectrum to appear different to its orientation which varies relative to the direction and polarization of the excitation and collection beams. Looking at figure 7(a) an overlay of 15 spectra (baseline-subtracted and intensity normalized) can be seen.
They were taken over randomly chosen positions on a bag of xylitol using a standard configuration and spot size on the of order of 100 microns. The spectra could easily be mistaken for being a group of different materials the intensity of the peaks vary that much. Figure 7(b) is a HQI histogram of 21 similar measurements. Using a passing threshold of 95, there are 3 false negatives.
The average and standard deviation of the 21 HQI values are 97.6 and 2.7, respectively. Figures 7(c) and 7(d) show the corresponding results of 27 measurements of the same sample bag obtained with the STRam configuration, with the average and standard deviation of the HQI values at 99.98 and 0.011, respectively. As the STRam has an increased sampling area, the reproducibility is greatly improved, and the rate of false negative is reduced to zero.
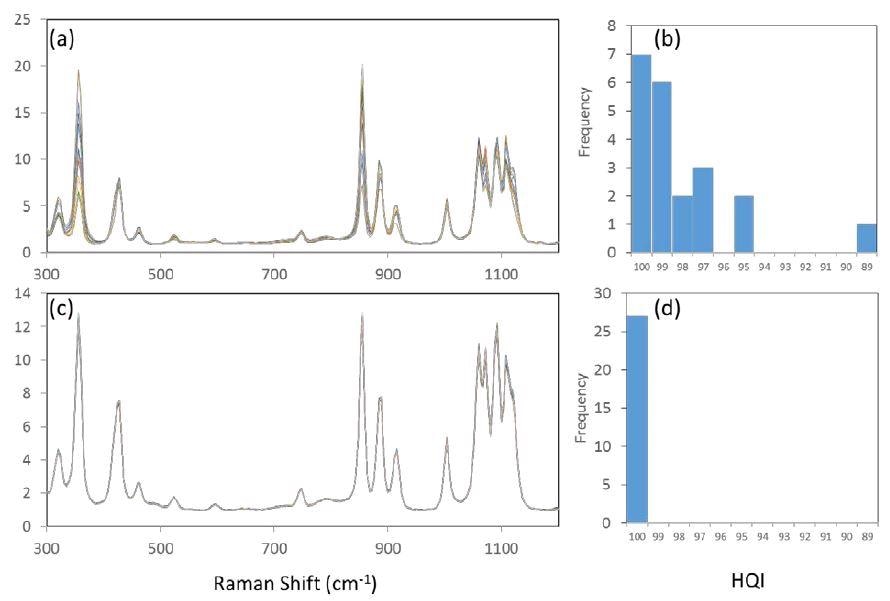
Figure 7. Comparative spectra of crystalline xylitol as measured at various sample positions. (a) overlay of 15 spectra acquired with conventional Raman configuration; (b) histogram of 21 HQI values with conventional Raman configuration. (c) overlay of 15 spectra acquired with STRam configuration; (d) histogram of 27 HQI values with STRam configuration.
System Versatility with Sampling Kits
There are a range of optimized sampling kits that can be used to augment the See Through STRam system and fit specific applications. These kits use the same high-performance hardware and software platforms and can be equipped to the ST probe for optimal measurement of different sample forms directly (Focus Adaptor and Surface Regulator).
The Focus Adaptor takes the excitation beam from the ST probe and focuses it into a spot of diameter ~100 µm, with a working distance of roughly 15 mm. Attaching the Surface Regulator to the Focus Adaptor brings the focus to contact distance.
To measure liquids in glass bottles it is best to use a traditional confocal Raman probe. However, for thick or double-layered glass bottles, the STRam configuration can be used with these optimized sampling kits with working distances altered so that the laser is focused within the glass container, at the same time minimizing fluorescence interference from the glass.
The See Through configuration is simple to adapt to a confocal configuration, allowing standoff, contact, or microscopy Raman analysis.

Summary
The See Through STRam technology allows examination and identification of chemical species covered by diffusely scattering media. The large sampling area improves measurement reproducibility for heterogeneous and crystalline samples. The reduced power density allows measurement of photolabile or thermolabile samples. These characteristics greatly expand the utility of Raman spectroscopy.
References and Further Reading
- P. Matousek, I. P. Clark, E. R. C. Draper, M. D. Morris, A. E. Goodship, N. Everall, M. Towrie, W. F. Finney, and A. W. Parker, “Subsurface Probing in Diffusely Scattering Media Using Spatially Offset Raman Spectroscopy”. Appl. Spectrosc. 59, 393 (2005).
- S.J. Choquette, E. S. Etz, W.S. Hurst, D. H. Blackburn, S.D. Leigh. “Relative Intensity Correction of Raman Spectrometers: NIST SRMs 2241 through 2243 for 785 nm, 532 nm, and 488 nm/514.5 nm Excitation”. Appl. Spectrosc. 2007. 61(2): 117-129.
- P. Matousek, E. R. C. Draper, A. E. Goodship, I. P. Clark, K. L. Ronayne, and A. W. Parker, “Noninvasive Raman Spectroscopy of Human Tissue In Vivo”. Appl. Spectrosc. 60, 758-763 (2006).
- X.-F. Ling, Y.-Z. Xu, S.-F. Weng, W. H. Li, Xu Zhi, R. M. Hammaker, W. G. Fateley, F. Wang, X.-S. Zhou, R. D. Soloway, J. R. Ferraro, and J.-G. Wu. “Investigation of Normal and Malignant Tissue Samples from the Human Stomach Using Fourier Transform Raman Spectroscopy”. Appl. Spectrosc. 56, 570-573 (2002).

This information has been sourced, reviewed and adapted from materials provided by B&W Tek.
For more information on this source, please visit B&W Tek.