ODIN, a deep UV resonant Raman spectrometer, in combination with continued testing, has been shown to routinely outperform industry standards when it comes to analyzing biopharma goods. The technology has the added benefit of measuring delicate samples while still delivering high laser energy to the target and being simple to use.
High energy could be deposited on materials while operating in the deep UV. Damage could arise from this, and as the target material deteriorates, so do the spectral details that were collected. ODIN was used to study immunoglobulin (IgG), which is known to be highly susceptible to UV degradation, to evaluate both this effect and ODIN’s impact.
In 75% of human serum antibodies, IgG is a commonly found antibody. IgG is a perfect material to evaluate the instrument’s capabilities since it has already been tested by a number of researchers working in the deep UV Raman field.
For this experiment, the sample level concentration of IgG was 1 mg/ml in water. The spectra were collected using integration periods of 30 seconds and an average of 10 frames. The ODIN spectrometer’s design enables a larger spot to be deposited at the target, which lowers power density (in this example, 600 µm diameter).
IgG Spectra - A Comparative Study
Three distinct measurement settings yielded three different IgG spectra:
- Static; which means that the laser was continually directed at the same area of the sample
- Rotating; while the sample is rotating, an approximately 15mm-diameter circle is traced across the sample surface
- Custom; a 15 mm “to-and-fro” custom motion was added to ensure that no area of the sample received prolonged laser irradiation
Results
Figure 1 displays the final spectra. Since there are no distinct peaks between 700 cm–1 and 1500 cm–1, the spectra show that the sample has suffered significant damage in the static state. The quality of the data is improved by using a rotation stage, and peaks are now more noticeable in this area.
However, compared to the structure seen above 1500 cm–1, many peaks are 2–3 times weaker. The addition of the custom pattern significantly improves the spectral quality, suggesting that no damage was seen over the measurement period.
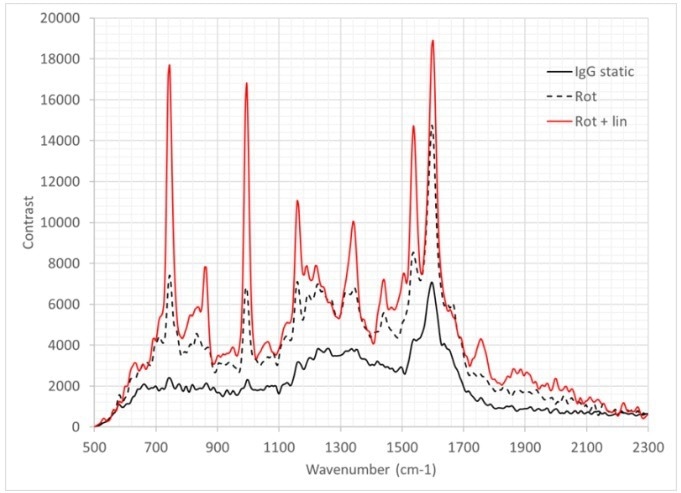
Figure 1. Raman spectra of IgG (30 second integration time, average of 10 frames). Solid black line = IgG is measured in static configuration; Dotted black line IgG measured with sample rotating during the observation; Red line = IgG measured with a complex motion applied using a rotation and linear stage. Image Credit: IS-Instruments, Ltd.
These spectra are superior to many that have already been published in literature and have not undergone any post-processing. This implies that the sample was not damaged during the observation time as a result of the larger spot in conjunction with the motion applied to the target.
References
- Demonstration of a compact deep UV Raman spatial heterodyne spectrometer for biologics analysis, Foster et al (2022)

This information has been sourced, reviewed and adapted from materials provided by IS-Instruments, Ltd.
For more information on this source, please visit IS-Instruments, Ltd.