When combined with traditional electrochemical experiments, Raman spectroscopy has proven to be an effective technology for conductive polymer characterization.
The mechanism of polymer conductivity is directly related to changes in the organic molecular structure as a result of induced electron delocalization. Raman spectroscopy combined with electrochemical techniques enable in-situ characterization of these changes in the molecular structure while electrochemical reactions are taking place.
Organic electronic cells like organic light emitting devices(OLEDs) provide a new material platform for building flexible and transparent electronic devices. A key focus in this area of research is to improve OLED’s material structure by improving its device efficiency, electrical conductivity and light-emitting stability over time.
One promising conductive polymer for OLEDs is poly (3,4-ethylenedioxythiophene)- poly(styrenesulfonate), also known as PEDOT:PSS. It is extensively used as a charge hole injector in organic optoelectronic devices because of its high chemical stability and high conductivity.
Until now most Raman experiments with conductive polymers were conducted using confocal microscopic Raman spectroscopy. The analysis shows comprehensive information about molecular structure changes at various potentials.
This article discusses the use of portable Raman spectrometer to conduct a chronoamperometric Raman study on PEDOT:PSS in an OLED structure. Gamry Instruments developed this application, which uses an i-Raman spectrometer from B&W Tek.
Experimental Procedure
The setup for an electrochemical Raman measurement is shown in Figure 1. It comprises a measurement cell, Raman spectrometer, computer and a potentiostat. There are two alternatives for excitation laser wavelengths in the i-Raman spectrometer – 785 or 532nm.
Based on the materials that need to be characterized, the right laser wavelength must be selected. In this article the laser wavelength used for PEDOT:PSS is 532nm. A USB is used to connect the Raman spectrometer and a computer.

Figure 1. Illustration of the experimental setup for electrochemical Raman experiments.
The target sample (PEDOT:PSS) is applied in the form of thin film on a metal surface that serves as a working electrode. An aqueous sodium sulphate solution is used as the electrolyte. Nitrogen-purging of the electrolyte was performed before measurement. A graphite rod is used as a counter electrode and an Ag/AgCl electrode is used as a reference electrode.
All the electrodes are connected to a Gamry potentiostat and connected via USB to a computer.
Sample / Cell
The Framework software from Gamry allows adjustments to the different parameters for the potentiostat and the Raman spectrometer. Figure 2 shows the user interface for the chronoamperometric experiment. Both the Raman and electrochemical experiments run concurrently once the experiment is commenced.
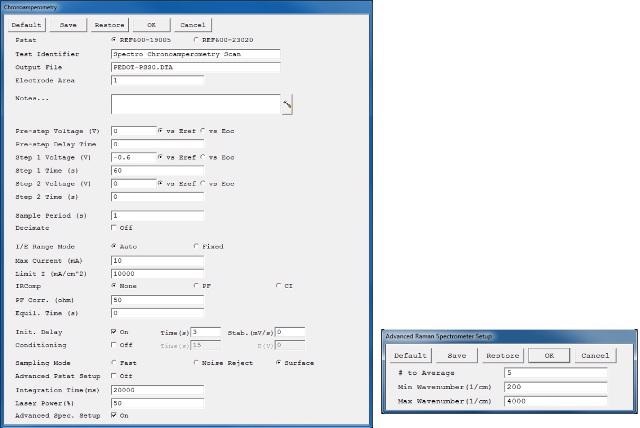
Figure 2. User interface for a chronoamperometric Raman experiment. The advanced spectrometer setup is highlighted in red.
The first section of the user interface enables adjustments in the chronoamperometric experiment parameters. This section is almost the same as all Gamry's standard electrochemical experiments. There are three additional lines at the end, which contain parameters for manipulating the Raman measurement.
The time taken for acquiring a single Raman spectrum is termed as the integration time. Higher Raman intensity is caused by longer integration times. The electrode is subjected to a longer laser exposure that can alter it because of heat generation, while using longer integration times, the detector can be saturated.
The laser power is provided as a percentage of the full power. An increase in power level causes an increase in signal intensity. However, the electrode is also under longer exposure to the laser which can alter it due to heat generation. Furthermore, the detector can be saturated when using longer integration times. The signal intensity increases with increases in power level. Again, higher laser power can alter or destroy the sample. Determining the optimum level of integration time and laser intensity for attaining the right signal-to-noise ratio without changing or destroying the sample is essential.
If "Advanced Spectrometer Setup" is checked, another window pops up after "OK" is pressed (Figure 2). This setup permits adjustment of other Raman settings by the user. The first line termed as "# to Average" helps add an averaging function. Based on multiple spectra, the final Raman spectra will be averaged. This enhances the measurement’s signal-to-noise ratio however results in longer exposure times to the laser.
The other two parameters are known as "Min Wavenumber" and "Max Wavenumber" and define Raman Shift’s (cm-1) spectral range display during the experiment. Irrespective of the set range, the final measurement file saves the complete spectrum from 176 to 4000 cm-1 is saved in the final measurement file.
Test Results and Discussions
Figure 3 shows different Raman spectra at a range of potentials during a number of chronoamperometric experiments with PEDOT: PSS. The integration time was preset to 20s and an average of five spectra were obtained resulting in 100s exposure time for every saved spectrum. The laser power was set to 50%.
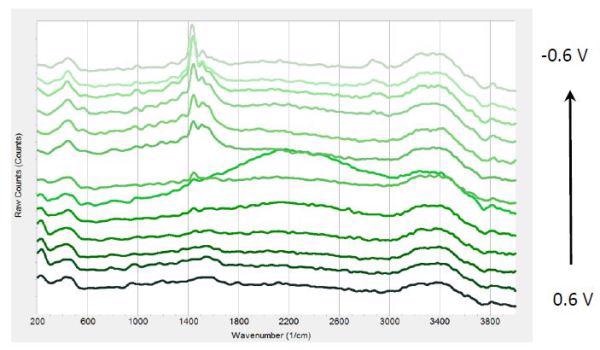
Figure 3. Raman spectra at different potentials from 0.6 V to -0.6 V from bottom to top in 0.1V steps.
The chronoamperometric experiment used an interface 1000 potentiostat. From 0.6V to -0.6V, the polymer was reduced in a number of steps. At the time of potential reduction, a 1447cm-1 peak is seen that becomes highly intense at negative potentials. Furthermore, there is a peak shift between 0V and 0.6V by -17cm-1. At around 1520, 1570 and 2870 cm- 1, three weaker bands are seen.
According to published works, the strong peak at 1447cm-1 can be accounted to ring C-C stretching vibrations from PEDOT. An increase in the conjugation length of oxidized components to their neutral state at the time of reduction causes this negative shift.
PEDOT reduction can cause long-term LED stability and reduced efficiency. During LED operation, electrons are withdrawn from PEDOT and electron holes are created in the polymer layer. In contrast, electrons are injected into the electron transporting layer close to the cathode. When electrons and electron holes recombine, radiation is emitted. However, recombination does not take place always. It is possible for electrons to move to the PEDOT-PSS layer and reduce PEDOT.
Conclusions
Characterization of electrochemical reactions is possible by simultaneously using Raman spectroscopy and electrochemical reactions. This integrated technology enables comprehensive characterization for a range of reaction mechanisms.
Chronoamperometric Raman experiments were used to analyze the structural changes of PEDOT:PSS during its electrochemical reduction by deploying the portable i-Raman system coupled with a potentiostat from Gamry Instruments. The results offer beneficial data with regards to enhancing OLED lifetime and efficiency.

This information has been sourced, reviewed and adapted from materials provided by B&W Tek.
For more information on this source, please visit B&W Tek.